
The size of Scotland’s inherited fiscal deficit, and how best to deal with it is likely to remain a highly relevant issue if the prospect of a second independence referendum rises. Unlike the currency issue this topic is one that has been little debated by those who favour independence.
The Scottish Government has published the latest edition of GERS, covering financial years 2014-15 to 2018-19. Here we look at (i) the latest results for Scotland’s fiscal balance (i.e. tax revenues less public expenditure), (ii) project forward Scotland’s absolute and relative (to the UK) fiscal balance up to 2023-24, and (iii) examine the implications for a potential Second Independence Referendum.
Key Points
• Scotland’s overall fiscal balance improved by £1.1 billion in 2018-19, from £-13.8 billion to £-12.6 billion. However, revisions to earlier years means that the balance for 2017-18 worsened, by just over £0.3 billion.
• Relative to the size of the economy, Scotland’s deficit amounted to 7.0% of GDP, while the UK’s amounted to 1.1% of GDP.
• Scotland’s relatively poorer position vs the UK can be explained by the fact that while its population share is 8.2%, its share of onshore Revenues is below this, at 7.8%, and its share of Expenditure is above it, at 9.3%.
• Looking forward, the latest OBR forecasts suggest that Scotland’s fiscal balance will worsen a little and then hover just below the £-13 billion mark up to 2023-24 (i.e. around 6% of GDP).
• North Sea revenue prospects remain subdued. The latest OBR forecast is of between £1 and 2 billion a year, based on around $63 a barrel. That range is well below the near £7.5 billion average seen over the period 2005-06 to 2011-12.
• The latest GERS figures confirm that any Second Independence Referendum needs to involve greater debate on how an underlying fiscal deficit position, of close to 6% of GDP, might be lowered to a more manageable one, i.e. of 3% or under of GDP (a reduction of £6 to 12 billion). The latest fiscal deficit projections are over £1 billion higher than estimated at the time of the Sustainable Growth Commission work, as a result of new data and a variety of revisions.
• This debate will need to address whether, and if so how, such an adjustment could be managed without a return to a period of public spending austerity, both in general terms and specifically with regards to non-NHS budgets.
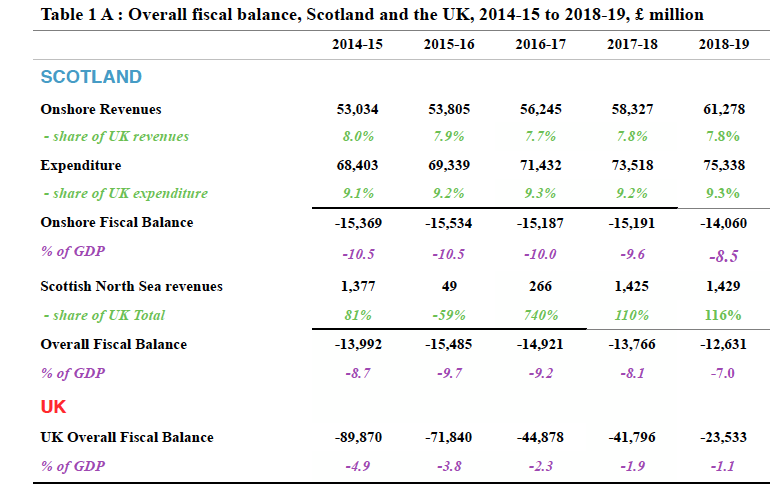
Scotland’s fiscal balance, 2014-15 to 2018-19 (see Table 1 A)
– Scotland’s overall fiscal balance (i.e. total Scottish revenues (onshore plus offshore) less total Scottish public expenditure) improved by £1.1 billion in 2018-19, to stand at £-12.6 billion;
– Over the 5 years shown in GERS, Scotland had a notably worse fiscal deficit position (in terms of the size of the deficit as a share of GDP) than the UK in every year. In the past, when offshore revenues were high, the reverse has been the case, although the last time this occurred was in 2011-12;
– Scotland’s share of UK expenditure has remained fairly steady at around 9.2 to 9.3% in recent years. However, its share of (onshore) tax revenues has declined from 8.2% to 7.8%.

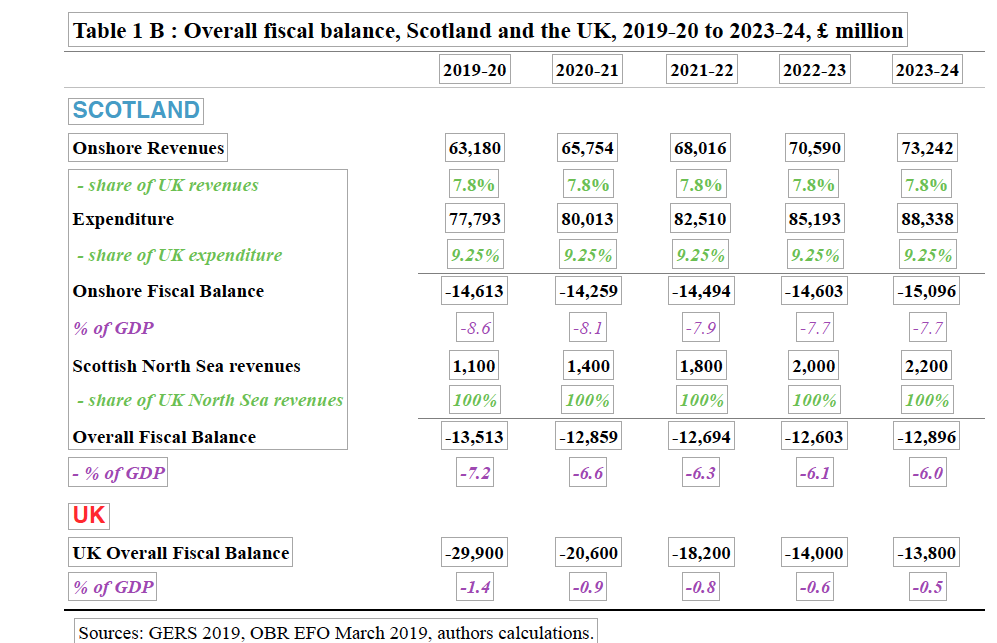
Scotland’s projected fiscal balance, 2019-20 to 2023-24 (see Table 1 B)
Projections of Scotland’s overall fiscal balance beyond the years shown in GERS have been made using the following assumptions:
The main points of interest to emerge from the forecasts are:
– Scotland’s overall fiscal balance is projected to be just below the £-13 billion mark by 2023-24, equivalent to 6% of GDP.
– Relative to the UK, Scotland’s fiscal position remains significantly worse (in terms of the size of the deficit as a share of GDP) than the UK. This equates to a differential of around £2,100 per person, or to an adjustment of almost £12 billion that would be needed for Scotland to reach the same fiscal position as the UK.
– Scotland’s future budget position will, in part, be influenced by whether or not its share of UK onshore revenues continues to decline. Of late, this share has declined from 8.2% in 2012-13 (just below Scotland’s population share) to 7.7% in 2016-17, although it has recovered a little since (to 7.8%). The decline has been fairly widespread, including with respect to: Income Tax; National Insurance contributions and VAT. The forecasts in Table 1 B assumes that Scotland’s revenue share does not continue to fall, but if this assumption turns out to be overly optimistic then Scotland’s fiscal balance would worsen further.
Future North Sea revenues remain highly uncertain. The estimates used in Table 1 B are based on the latest OBR forecasts (March 2019) which assume an oil price of around $63 (£47) a barrel, similar to the price seen over the last few months. Even if the price were to rise to $100 a barrel it is estimated (in the most recent (2015) Scottish Government analysis) that NSOR would still be under £3 billion.
(Note: Chart 1 shows a one-off increase in the UK and Scottish deficits in 2019-20. This is due to UK government tax policy changes resulting in a re-profiling of tax payments that reduces revenues for that year.)
Implications for a Second Referendum Debate
As well as acting as a record of the Scottish Government’s existing fiscal position, GERS is also the best starting point from which to project forward in order to understand some of the public finance implications of independence.
The future fiscal position of Scotland at the point of independence – based on existing UK, Scottish and EU tax and spend patterns – is illustrated in Tables 1B and 2B. On the assumption that independence took place in 2023-24 then Scotland would inherit a fiscal deficit of nearly £13 billion (or 6% of GDP).
The anticipated size of this deficit is not particularly controversial. The figures shown here are roughly in line with those estimated by other commentators (e.g. the Institute for Fiscal Affairs (IFS)) and with those utilised in the SNP’s Sustainable Growth Commission report (SGCR) as an independent Scotland’s fiscal starting point. In fact, due to the emergence of new data and data revisions the Scottish fiscal balance estimates shown here (in both absolute and relative to the UK terms) are higher than those used in the SGCR, by around £1.5 billion (although roughly the same as a % of GDP). Again, such shifts are largely non controversial and there may be further changes, potentially in either direction, to come.
Such a level of inherited deficit would need to be brought down to a more manageable level. However, what this target level should be is open to debate and the final choice will significantly affect the size of the adjustment made. For example:
– the shift from a fiscal deficit of 6% of GDP to one of around 3% is equivalent to around a £6.5 billion reduction in the Scottish deficit (as shown in Table 2 B). (Note: a 3% target is seen by some commentators as necessary in order to reach a ‘stable’ fiscal position, i.e. one which could be comfortably financed);
– the shift from 6% of GDP to the UK average of 0.5% of GDP is equivalent to a near £12 billion reduction (again, as shown in Table 2 B). (Note: this equates to the same level of deficit per head as seen at the UK level.)
The latter figure (£12 billion) is what is effectively being lost as a result of Scottish independence from the UK. (In other words, £12 billion is the extra funding Scotland receives from being part of the UK, due in part to higher needs based on criteria such as geography, economic and social conditions, etc and partly on non-needs based historical accident.) The former figure (£6.5 billion) is a sub-set of this, i.e. it involves a £6.5 billion reduction in the level of the deficit along with moving to a higher on-going deficit level than is seen for the UK (i.e. up from 0.5% to 3% of GDP).

While these starting point estimates are fairly widely accepted, how any such ‘sustainable’ level of annual fiscal deficit might be reached is much more controversial.
The SGCR looked in some detail at how this starting point might be altered at the point of separation (see Full Report). (Note: the SGCR included projections made by this author to judge what that starting point might be expected to be.) Commentary on the strengths and weaknesses of the SGCR analysis can be found in the Scottish Trends paper ‘Reflections on the SNP’s Sustainable Growth Commission Report’ . Furthermore, the Scottish Trends analysis paper ‘Potential impact of Brexit analysis and negotiations on any second Scottish independence referendum’ (see HERE) looks at further ways in which fiscal adjustments might be made.
While there are a variety of ways in which the inherited fiscal deficit position might be reduced, many of these will be subject to negotiation at the point of separation. As Brexit has shown, the degree to which any such proposals come to fruition, either at all or on the scale originally foreseen, is difficult to predict in advance.
All of this means that there is a lot at play for in terms of i) how much by, and how quickly, to reduce the inherited deficit, and ii) the degree to which this adjustment should be spread between: increased taxation; reduced public spending, and; increased borrowing.
As the political debate starts to swing away from the outcomes of Brexit and towards the possible implications of Scottish independence, it seems inevitable that greater attention will be focussed on these difficult questions.
So far the post SGCR discussion has been dominated by querying the choice of currency in an independent Scotland and there has been little debate over how best to reduce the size of the fiscal deficit. However, what deficit reduction strategy should apply will clearly be a controversial question, and potentially influential on the outcome of the referendum itself. Greater clarity needs to emerge on this vital issue. If it does not, then pressure may grow for a second, confirmatory, vote, i.e. once a fuller understanding of the implications of independence emerges.
First published by the author on Scottish Trends
Image courtesy of Ewan Morrison
Further reading: Fraser of Allander Institute blog below and here
Common Space, Gap between spending and revenue fell by £1bn
Tom Gordon, The Herald, Deficit six times bigger than UK’s
Richard Murphy, Tax Research UK, 21 August 2019
Update on GERS 2019 analysis
Some of the commentary on yesterday’s publication was confused in its thinking and it is worthwhile explaining why.
1) There was some suspicion as to why, taken together, the combined deficit for Scotland (£-12.6 billion for 2018-19) and for Wales (£-13.7 billion for 2017-18, see Welsh Fiscal Analysis estimates, 29/7/2019) is greater than the fiscal deficit for the UK as a whole (£-23 billion in 2018-19).
In fact, this is not surprising. Latest estimates by the ONS (28/05/2019) for 2017-18 showed UK constituent country fiscal balances (inc. North Sea oil revenues distributed on geographic basis) as:
• UK: £-41.8 billion
• England: £-5.7 billion
• Wales: £-13.7 billion
• Scotland: £-13.3 billion
• Northern Ireland: £-9.2 billion
Given that the UK fiscal balance is estimated to have improved by £19 billion in 2018-19, this implies projected UK constituent country fiscal balances for 2018-19 of approximately (rounded to the nearest billion):
• UK: £-23 billion
• England: £+11 billion
• Wales: £-13 billion
• Scotland: £-12 billion
• Northern Ireland: £-9 billion
Hence, the fact that Scotland and Wales (and Northern Ireland) have a combined deficit above that of the UK is explained by the fact that England has moved into a position of fiscal surplus.
2) There was also confusion by some over how Scotland, with a population share of just 8.2% of the UK as a whole, could account for over 50% of the UK deficit. However, such a situation is perfectly possible and indeed to be expected under certain conditions.
When a balance (in this case the fiscal balance) is arrived at by aggregating across more than one element (in this case the four UK constituent countries) then, as that balance approaches zero, it becomes more and more likely that a) some of the contributors will be in a positive balance position and others in a negative balance position, and thus b) that these balance shares may be very different to population or GDP or any other shares, as is happening in this case (indeed a particular contributor’s deficit could easily be over 100% of the aggregate figure).
A similar ‘distortion’ applies in other circumstances. For example, when looking at the relative position of two countries with differing, but linked (like Scotland and the UK) fiscal deficits then when Country A’s fiscal deficit stands at 12% of GDP and Country B’s stands at 6%, then Country A’s is double that of Country B’s. Should both countries’ deficits be falling over time, near proportionately, then when Country A’s gets to 6%, Country B’s will be below 1%, at which point it could be claimed that Country A’s deficit is at least six times higher than Country B’s. While this is true, it is largely irrelevant when analysing the situation. The reality is that both deficits are falling but when Country B is in balance Country A will still have a deficit. To take this example to its extreme, if the UK has a £1 deficit and Scotland still has a £12 billion pound deficit then Scotland’s is higher by a near infinite amount! (Equally, point 1 above highlights the fact that, in 2018-19 England most likely has a surplus while Scotland has a deficit, which makes this type of ‘comparison of deficits’ redundant.)
Further update in light of political comments:
A spokesperson for Finance Secretary Derek Mackay yesterday stated that “GERS also shows our deficit reduction is ahead of the Growth Commission’s projections.”
Furthermore, SNP depute leader Keith Brown stated: “This year, the deficit fell by one per cent. So, on that trajectory, it would only take us less than three years from now to get to the Growth Commission target of three per cent.”
While both statements are technically correct they give a false impression of what is actually happening.
With regards to the first statement, the Growth Commission projections referred to were made by myself, taken from a Scottish Trends paper of March 2017 (IFS estimates were also referred to). The table below compares those estimates with the actual out-turn:

Table 1 shows that the Scottish fiscal balance, as a % of GDP, is indeed better than I had projected it would be. However, it also shows:
– Unlike the UK deficit, the Scottish fiscal deficit is worse in cash terms than was predicted (£12.6 billion rather than £12.2 billion) in 2017. However, Scottish GDP is higher than expected and so the deficit as a % of GDP has fallen;
– The reason the Scottish deficit is higher is because the Scottish share of onshore UK revenues has fallen from an estimate of 8% to an out-turn of 7.8% while the Scottish share of expenditure has risen from an estimate of 9.1% to an out-turn of 9.3%. However, some of this deterioration has been offset by an improvement in North Sea oil revenues, up from £0.7 billion to £1.4 billion. (Note, however, that the Growth Commission works from the basis that it is the onshore balance that should be targeted.);
– As a result of these shifts, the UK fiscal balance, as a % of GDP, has improved by even more than the Scottish fiscal balance, +0.8% of GDP for the UK vs 0.4% for Scotland. One interpretation of this could be that the goal of the UK Government to move towards fiscal balance has been more effectively achieved than was expected in 2017.
One swallow…
With regards to the second statement, using such a simple extrapolation of one year’s figures is, unsurprisingly, unwise. The premise on which Mr Browns calculation appears to be based is that the UK Government’s fiscal reduction plan is working well and will continue to do so. This is highly questionable. The improvement in UK (and Scottish) revenues in 2018-19 was bigger than expected and may well not continue, leaving aside the one-off slowdown expected in 2019-20.
One noticeable impact of the various shifts to fiscal balance relevant data since the Growth Commission’s use of Scottish Trends projections is that Scotland’s position relative to the UK has worsened. The impact of moving from being part of the UK to being independent, based on the same tax and spend policies, is now estimated to be £11.2 billion, rather than £9.8 billion (both based on the financial year 2021-22). To be clear, this is not the figure that would need to be adjusted for at the point of independence (by cutting spending, increasing taxes or increasing borrowing), rather it is the effective financial loss of moving from a shared public spending system to an independent one.
Scotland’s fiscal balance position, and GERS role in understanding it, is a subject where the figures can readily be distorted, so it is worthwhile keeping the underlying picture as clear as possible. This is especially true where official, government approved, statistics are involved.
Leave a Reply