
Nicola Sturgeon, Scotland’s First Minister and SNP leader, has fired the starting gun for a renewed debate and campaign around a second independence referendum by 2021.
Any decision about if or when to stage #indyref2 depends heavily upon Scotland’s economic prospects, with or without Brexit. In 2014, arguably, serious doubts about these under independence scuppered the Yes campaign.
Here, the author, a leading independent Scottish economist, examines the latest Quarterly National Accounts for Scotland (QNAS) statistics for 2018, teasing out the implications for a second independence referendum. He says:
The Scottish economy, including the North Sea, has improved in the last couple of years after its dire performance in 2015 and 2016 due to a turnaround in North Sea output. However, onshore growth remains sluggish compared to the pre Great Recession norm, a position replicated in many other countries.
The latest data shines a light on many of the economic areas that are likely to dominate the economic debate around any second independence referendum. The decline of the North Sea’s contribution to the Scottish economy and finances since the data used at the time of the 2013 White Paper (largely based on 2011 and 2011/12 data) has clarified the picture to some extent. Meanwhile, the fundamentals remain little changed, including how independence would impact on Productivity, the Fiscal Balance and the Current Account.
Key points
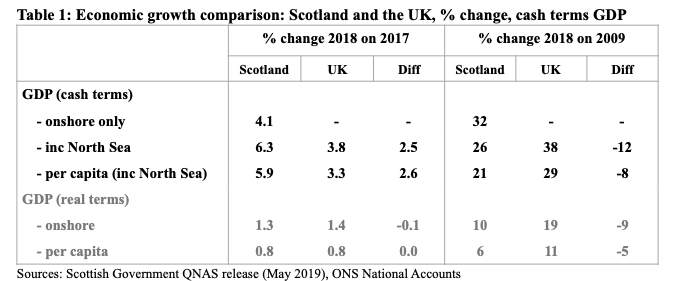
• Latest data reveals growth of 6.3% in (cash terms) Scottish GDP for the year 2018 as a whole, well above the UK growth level of 3.8%. (See Table 1) This is the fastest rate of growth seen since 2006, due to a revival in North Sea fortunes. However, in real terms, onshore growth was revised down to 1.3%, just below the UK figure of 1.4%.
• Scottish GDP per capita for 2018 as a whole is, for the fourth year running, very similar to that seen for the UK level (£32,771 vs £31,862 which is equivalent to a differential of just under 3% in Scotland’s favour).
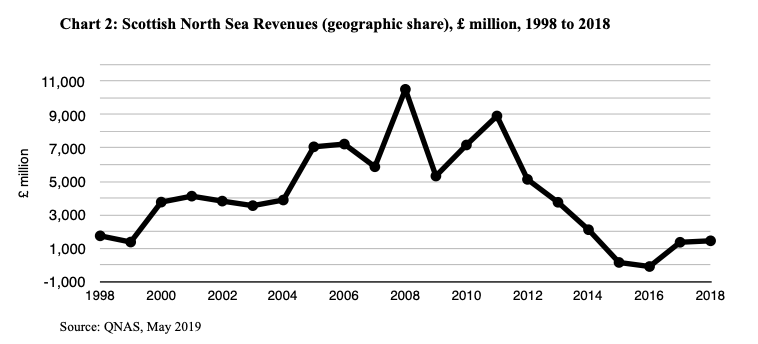
• North Sea Oil-related Tax Revenues have recovered from being negative (£-87m) in 2016 back into a surplus (£+1.45bn in 2018), although this is still well below the £7bn a year average seen over the 2005-2012 period.
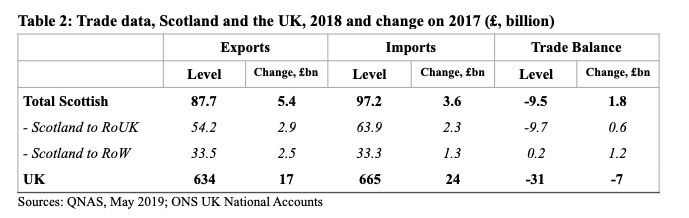
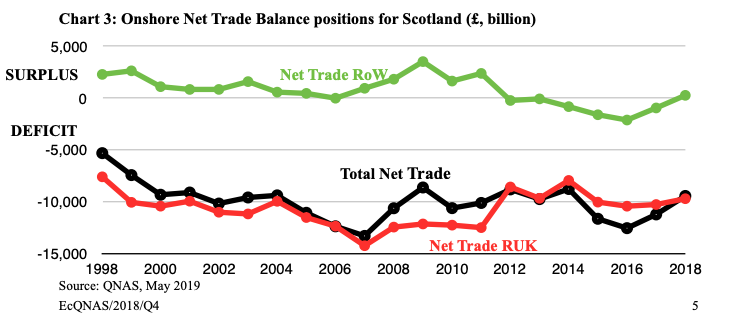
• Scotland’s onshore Trade Deficit improved by £1.8bn in 2018, to stand at £-9.5bn. While Scotland’s trade balance with rUK remains heavily in the red, the trade balance with the Rest of the World (ROW) has moved from a small deficit to a small surplus, despite Brexit uncertainty.
• In terms of any Second Independence Referendum, the latest data suggest that claims made at the time of the first referendum, of much higher (than UK average) Scottish wealth and tax receipts – both based on North Sea activity from around 2011 – will no longer be relevant.
However, the underlying (onshore) economic and fiscal fundamentals are little different now to at the time of the first referendum. Economic debate around any second referendum is therefore likely to concentrate on: productivity growth prospects; how to narrow Scotland’s fiscal deficit; and how to improve the Current Account.
Growth in GDP
Total GDP in current prices (including North Sea output)
• In cash terms, the Scottish economy grew much faster than the UK in 2018, due to a revival in offshore output. (See Table 1.)
• However, since 2009 (i.e. post recession) the Scottish economy has grown at well below the pace seen for the UK economy as a whole. Much of this differential can be accounted for by the weakening contribution from the North Sea, due to a combination of falling production and prices, although slower population growth has also played a role.
Onshore GDP in real terms (i.e. after adjusting for inflation and excluding North Sea output)
• The revised estimate of the main Scottish Government measure of ‘real terms’ onshore GDP shows growth for 2018 as a whole at 1.3% (down from 1.4%), similar to the UK.
• Since 2009 the UK has grown at almost twice the pace as the onshore Scottish economy. This differential has been due to a faster rising population and to the poor, NSO related, Scottish performance in 2015 and 2016.
Second Independence Referendum implications
Scotland’s economic (GDP) growth rate is a crucial measure of economic success. In ‘real’ terms it is closely associated with growth in productivity and this subject is likely to be a vital element of debate in the next independence referendum. Pro-independence campaigners will claim that independence will lead to higher productivity growth, as outlined in the recent SNP Growth Commission report, while anti-independence campaigners will claim that a weakening of UK ties will lead to a negative impact on future Scottish productivity.
The reality is that, as the on-going productivity growth problems seen across most countries post the Great Recession suggest, it is difficult to both understand why productivity has slowed and what to do about it (or governments would already be doing it). However, this very uncertainty means that the subject is likely to remain a fertile area for debate, as little can be proved either way.
GDP per head of population
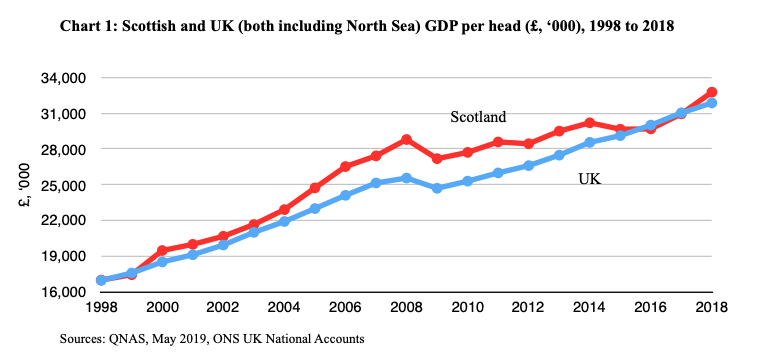
• Scottish and UK GDP per head levels have been very similar for the past four years. Chart 1 shows that Scotland’s GDP per head (also referred to as per capita) moved from near parity in the late 1990’s to being well above that of the UK, before falling back to being near parity again in recent years. The chances of a return to a significant Scottish advantage (as happened over the decade from 2005 to 2014) are slim, as rising US shale related oil production has put a cap on oil prices despite on-going political and production problems in Venezuela and the Middle East.
• However, for a country like Scotland with significant foreign ownership (especially in terms of financial services and North Sea oil) Gross Nation Income (GNI) is a more pertinent measure of national prosperity than Gross Domestic Product, as it adjusts for income flows relating to Scottish owned assets overseas and to overseas owned assets in Scotland. The Scottish Government’s latest estimates of GNI show that, while Scotland is around 3% higher than the UK in GDP per head terms, in GNI per head terms Scotland was a little lower, by around 3% in 2017.
Second Independence Referendum implications
Scotland’s significantly higher GDP per capita (vs the UK) around 2011 was given a high profile in the YES Scotland campaign during the first independence referendum, including claims that Scotland was the 8th wealthiest country in the OECD and amongst the top 20 wealthiest countries in the world. The latest figures suggest that such a, misleading, statistic is unlikely to be given such prominence during any second referendum campaign.
On the other hand the, now more developed, Scottish GNI figures suggest that Scotland’s economic prosperity, in terms of GNI per head, is very similar to that of the UK as a whole.
Scottish Government’s Finances including the contribution of North Sea activity
• Income Tax remains the strongest contributor to overall Scottish tax receipts (£12.8bn), followed by VAT (£12.2bn) and then National Insurance Contributions (£10.8bn).
• As recently as 2008 North Sea Oil (NSO)-related taxes were the second largest contributor to Scottish public sector revenues, just below the level of Income Tax raised. However, while NSO tax revenues have recovered from being negative (£-87m) in 2016 back into a surplus (£1,449m in 2018) this partial revival still contrasts starkly with the 2005-2012 period when Scottish offshore oil revenues averaged over £7bn a year and never fell below £5bn in any single year. (See Chart 2.)
• Any recovery to 2005-2012 type levels is unlikely as the Scottish Government’s latest projection of future oil tax revenues makes clear. It estimates that, even at $100 a barrel, the North Sea would bring in less than £3bn a year of tax revenues.
Second Independence Referendum implications
The importance of North Sea revenues to the independence debate has diminished along with their actual size. Furthermore, the SNP Growth Commission explicitly removed them from the fiscal equation by recommending that any such “windfalls” should be set aside in a Fund for Future Generations.
This then leaves the ‘onshore’ Fiscal Balance to worry about. While Scotland’s GDP per head and its tax take per head are not dissimilar to the UK’s as a whole, it’s public expenditure per head is well above (around 13%) the UK level, which leads to a significantly higher fiscal deficit (per head) in Scotland than in the UK. It is this relatively large deficit that the SNP’s Growth Commission has tried to address with its “target of delivering the initial deficit target of under 3 per cent of GDP within 5 to 10 years”. As the internal and external arguments around this policy suggest, how to deal with the fiscal deficit is likely to remain a highly contentious issue in any second independence referendum campaign.
Trade (excluding North Sea) and the Current Account (Balance of Payments)
• The onshore Trade Deficit has improved by £1.8bn in 2018 and now stands at £-9.5bn.
• This improvement is mainly down to a shift from a small deficit to small surplus with respect to trade with RoW, which might have been been brought about by a positive Brexit/exchange rate depreciation impact on Scottish overseas trade figures, although it was still unexpected the worsening in the UK’s Trade Balance in 2018.
• Scotland’s Trade Balance with respect to the Rest of the UK (RUK) remains heavily in deficit, at around £-10 billion, but has improved since 2017.
• QNAS also contains experimental data for Scotland’s trade position including the North Sea (offshore) up to 2017. This shows a smaller deficit, of £-3.6bn in 2017. However, including the North Sea makes it even more important to include the Primary Income Balance (PIB), which takes into account the extent of North Sea income that ends up with its overseas owners. Doing so would lead to a (partial) Current Account deficit of £-12.8bn in 2017.
Second Independence Referendum implications
A country’s Balance of Payments (BoP) is a vital barometer of its economic health. In particular, a persistent and large Current Account (CA) deficit highlights a country living beyond its means and can prove problematic. In the case of the UK, such a deficit has existed for over 30 years and has significantly worsened since 2011, but it remains manageable.
Unfortunately, there are no BoP or CA figures for Scotland. The trade figures shown above are only a partial picture. Of the other key elements, the PIB and the Offshore Balance are both now available, although only in experimental form, and the Secondary Income Account is still being developed.
While important, complete data on the Scottish Current Account remains unavailable. In political terms it also remains an under-discussed area at both the UK and Scottish level, with the Fiscal Balance garnering much more interest. However, this might change leading up to any second referendum due to the potential influence of the CA on the different currency choices being put forward in the case of independence.
Savings ratio
• The Household Saving Ratio for Scotland in 2018 was 3.4%, the lowest on record (i.e. since 1998), and down another percentage point from last year. In comparison the UK figure was 4.2%, which, along with 2017, is the lowest on record (i.e. since 1963).
First published by Scottish Trends where a fuller version, including notes/references, is available
Further reading: Fraser of Allander Institute on the effect of excluding oil/gas and on the fuller Scottish per capita GDP
Extract therefrom:
In 2018, Scottish GDP per person is estimated at £32,800 including a geographical share of oil and gas output and £29,800 excluding of oil and gas output. This compares to a UK figure of £31,900 (including oil and gas output). The Scottish Government don’t publish this, but if we exclude oil and gas at the UK level this lowers the UK figure to around £31,600.
Therefore, it is true to say that GDP per capita in Scotland, including oil and gas, is higher than in the UK as a whole. But there a few important caveats….
Leave a Reply