
Essentially, productivity is the output produced by a single unit of labour. Given a fixed workforce, and adjusting for inflation, the economy grows by each worker (or working hour) producing more output, i.e. by productivity rising.
This in turn allows for wages (and living standards) to rise, as each worker is producing more and so can be rewarded more.
So how has Scotland been performing, in both absolute and relative terms, with respect to this very important measure?
Scottish productivity data
Recent Scottish Government and ONS publications have provided estimates for Scottish and UK productivity in 2018. This suggests yet another poor year for the UK, +0.5%, but an unexpected boost for Scotland, +3.8%. The rise in Scottish productivity is dominated by a fall in hours worked (-2.3%) alongside a small rise in output (+1.4%).

However, alternative ‘hours worked’ data for Scotland, based on the Annual Population Survey, show a rise in hours worked (+0.6%) in 2018, as opposed to a fall (-2.3%), which would result in a much smaller improvement in productivity.
In terms of the past 20 years, the annual productivity growth for Scotland averaged 1.5% from 1998 to 2007, the pre-Great Recession period, while more recently (2013 to 2018) it has fallen to 0.8%. Similar analysis for UK productivity shows a slowdown from 2.1% a year (1998 to 2007) to 0.7% (2013 to 2018). Although Scotland’s productivity growth of late has been marginally above that seen for the UK, this advantage is wholly down to the improvement seen in 2018, over which some doubts exist.
Analysis of productivity growth by industrial sector shows that some sectors experienced unusually high growth in 2018, including in: Manufacturing (+8%); Transport & Storage (+12%); Hotels & Catering (+13%); Administrative & Support Services (+9%); and Other services (+17%). Such big shifts in sectoral productivity are unexpected but not uncommon in Scotland.
In all but one of these high growth sectors the comparable productivity change at the UK level was much lower, at 1% or less and in all of these sectors the majority of the rise was due to fall in hours worked, as opposed to an increase in output.
Reasons why the ‘hours worked’ might change include: more/fewer jobs; a shift to/from part-time vs full-time; and longer/shorter working hours per week. Workforce jobs data suggests that any change to the number of jobs in 2018 does not explain much of the productivity change. This suggests that changes in work patterns were the primary source of falling ‘hours worked’. However, annual changes on the scale recorded seem unlikely and so doubts must be harboured over the reliability of the disaggregated ‘hours worked’ data.
Overall, the published productivity figures suggest that, at both an aggregate and at a disaggregated level, the results for Scotland are much more ‘noisy’ than for the UK, which is mainly due to higher uncertainty with regards to the regional labour market data, probably connected to sample size levels. This heightened uncertainty makes it very difficult to draw strong conclusions over Scotland’s recent productivity growth performance in relative terms. However, in absolute terms, like the UK, recent growth has been poor.
International Productivity Rankings
Reflecting the importance of productivity, the Scottish Government set itself the target, back in 2007, of ‘an improvement in Scottish productivity to rank in the top quartile of OECD countries by 2017’. However, the latest figures show Scotland’s ranking amongst OECD countries to be unchanged, at 16th, since 2007, towards the bottom of the second quartile.
But how realistic was this target in the first place? Analysis of the productivity scores and rankings of 37 comparator countries highlights a number of key points:
- First, the lack of comparative change in many countries over time;
- Second, the exceptions to the first point are almost all related to countries with considerable scope for catch up, principally those in Eastern Europe and in less economically developed economies like Chile, Korea and Turkey;
- Third, the biggest movers were: i) Ireland (UP) due to exceptional circumstances relating to the notional relocation of international companies output. In particular, Irish productivity rose by 16% between 2009 and 2011 and again by a dizzying 29% in 2015 alone. Most, if not all, of this post ‘Irish economic miracle’ productivity rise can be put down to accounting practices rather than ‘real’ changes in output per hour worked by Irish employees; ii) Norway (DOWN) due to fluctuations in the oil price affecting GDP;
- Fourth, excluding those countries with exceptional circumstances (Ireland, Luxembourg and Norway), then the highest performers are Belgium and Denmark, not countries normally associated with outstanding economic strength;
- Fifth, Denmark and Belgium have consistently seen productivity levels around 75% higher than those measured for Japan and New Zealand, even though the latter are not countries renowned for their economic backwardness.
These findings beg the question – beyond the discovery of substantial raw material resources (Norway), distortionary tax incentives (Ireland and Luxembourg) or catch up (Eastern Europe and South East Asia) – how realistic is it for government to attempt to target altering its ‘headline’ productivity ranking?
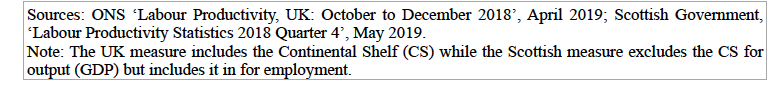
Furthermore, recent research has highlighted the uncertainty over these rankings due to national differences in how the data is compiled. A recent, relatively minor, change in methodology by the OECD resulted in the UK differential, in comparison to the USA, shifting from -24% to -16%, i.e. wiping out one third of the productivity shortfall.
Similarly, Scotland’s shortfall has been adjusted from -27% shortfall to -18%.
Other big winners (see Figure 2) included Sweden, moving from a differential of -12% to being amongst the leading nations, and Iceland, moving from -33% to just -11%.
Considerable doubt must exist over the accuracy of even these revised figures, as on-going concerns over measurement consistency across countries relate to: Financial Services, Public Services (including Health and Education), Real Estate and Construction.
All in all, great care needs to be applied when making
judgments comparing national productivity levels. As a result, choosing a shift
in international rankings as a government policy target is probably unwise.

Source: OECD, ‘International Productivity Gaps: Are Labour Input Measures Comparable?’, 2018
Improving productivity
The essential ingredients to improving productivity are fairly well understood, consisting of: a skilled and motivated workforce; good quality and widespread infrastructure; on-going investment in the latest technology; and an understanding and use of up-to-date processes and management techniques to combine these different elements.
Why then have such long understood and applied pro-productivity policies, increasingly, failed to produce results? Basically, the answer boils down to political and economic difficulties in implementing efficient policies.
For example, large transport infrastructure projects, like HS2, are often politically motivated and strong concerns exist over the impartiality of associated cost benefit analysis. Furthermore, using basic economic tools to help solve such problems, for example by introducing (even on a cost neutral basis) road charging, has proved too politically challenging for successive governments.
In terms of changing taxes, little of the thoroughly researched recommendations in the Mirrlees Review of 2011, Tax by Design, have come to fruition, largely due to them being seen as politically too challenging, despite their economic benefits.
Given past failures, it may be more fruitful to explore other avenues in order to raise productivity levels.
On skills investment, while we appear to be being better
educated, whether or not this is making us any more productive (in an economic
sense) or innovative (in a more rounded sense) remains debatable.
Drivers of productivity at the firm level – learning from the best performing companies
This is an increasingly fruitful area of analysis but also a complex one. Recent analysis suggests that differences in firm-level productivity within industries are a bigger determinant of the geographical differences in productivity than the differences in industry structures between areas.
While there is a long history of research into the impact of ownership, size and foreign direct investment (FDI) on productivity, other, less researched areas are coming more to the fore now. For example, the role and importance of management practices is better understood as is the relationship between firm-level trading and productivity, although problems remain with regards to establishing causation.
Despite these advances it remains difficult for governments to affect key business level decisions and practices on R&D, exporting, management practices etc. So while firm level based policies may be a potentially powerful source for future productivity gains, tapping into it is still a big challenge.
New ways of acting – frontier level innovation
Speaking at the Glasgow School of Art in 2018, Andy Haldane of the Bank of England highlighted the role of universities in creating more innovative graduates than now. He cites worries that the education system stifles rather than encourages creativity by being heavily skewed towards developing cognitive skills which were more appropriate to earlier forms of industrial development.
In future, what may be more appropriate are ‘multiversities’ which expand disciplinary horizons and are less subject-singular. They may also need to straddle generations, as well as these disciplinary, divides.
New sources of data and analysis might shed further light on productivity issues. The Productivity Insights Network (PIN) is carrying out a broad range of innovative work, including on why many large UK cities, including Glasgow, do not benefit from anticipated agglomeration effects. This work suggests that transport networks may be a large part of the explanation, a finding that could influence policy making decisions.
This all goes to show that despite past failings and current misgivings over how to solve the ‘Productivity Puzzle’ there remains a wide range of potential interventions that might restart and sustain future productivity growth. The above discussion gives only a flavour of what might happen over a narrow range of, complicated, research areas.
This idea may only be the tip of the iceberg in terms of re-organising post school education in order to improve efficiency and productivity. At present the UK Higher Education model appears to be more geared to traditional disciplines and cash maximisation than to straddling disciplinary boundaries and to creativity. Pertinent questions exist over long-standing traditions like: disciplines and course content; length of study; type of study (Higher Education vs Further Education vs Apprenticeship etc); and the apparent over- education of more than 30% of graduates.
Full version of this analysis available at Scottish Trends website
Image courtesy of Ewan Morrison
Leave a Reply