
The Scottish Fiscal Commission’s forecasts for economic growth in Scotland over the next five years, published in December, raised some eyebrows.
Growth in GDP per capita will average just half a percent a year over the period to 2022 according to the forecasts. This is about half the average growth rate seen during the noughties. It is also slower than the 0.7% average growth rate that the OBR is forecasting for the UK.
The latest GDP statistics for Scotland, published last week, included a downward revision to recent rates of GDP per capita growth. Prior to the revision, recent growth of Scottish GDP per capita had already been looking weak, with growth of just over half a percent between Q1 2015 and Q2 2017. But following the data revision this positioned has worsened, with GDP per capita actually shrinking fractionally over that same period, according to the revised figures. In contrast, UK GDP per capita grew 2.7% over the same period, opening up a marked gap in relative performance. (See chart).
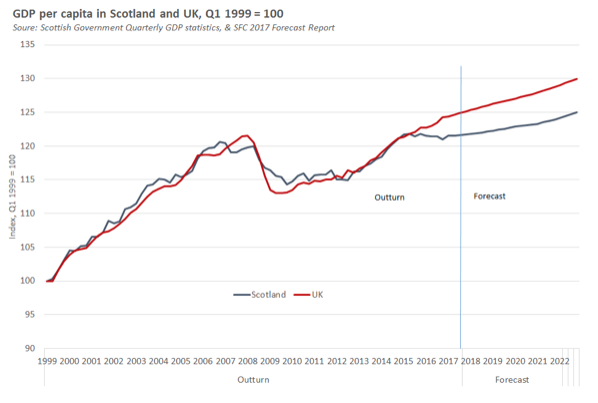
In this context, its difficult to argue that the SFC’s forecasts are too pessimistic. The SFC is effectively arguing that future growth will be more rapid than we’ve seen during the past 2.5 years, and on a par with average growth rates over the past decade (see Chart). (Scottish GDP per capita has grown barely 1% since Q1 2007).
True, the SFC forecasts do imply that the gap that recently opened up between Scottish and UK growth rates will continue to widen slightly going forward – but equally, the future differential performance between Scotland and the UK is not forecast to be as great as the one we have seen in the past three years.
Nonetheless, the SFC is forecasting that GDP per capita in Scotland will grow slightly slower than the OBR forecasts for the UK. It might be expected that slower growth in GDP per capita would translate into slower forecast growth in income tax revenues per capita in Scotland than in the UK. If it did, under the new fiscal framework for Scotland, the implication would be that Scottish income tax revenues would be smaller than the block grant adjustment for income tax. In other words, the Scottish budget would be worse off as a result of income tax devolution than it would have been without, under the Fiscal Framework arrangements.
But in fact, the SFC forecasts imply that Scottish income tax revenues will grow more quickly than the block grant adjustment. How can we reconcile these positions? (GDP per capita growing more slowly in Scotland than UK, but income tax revenues per capita growing more quickly?)
According to the SFC’s forecasting model, the main determinants of income tax revenues are employment and earnings. What are the SFC’s judgements about how these two factors will evolve?
- The SFC’s forecasts imply that the employment rate in Scotland will grow at the same rate as the OBR forecasts for the UK (strictly speaking, the 16+ employment rate is forecast to fall by around 0.15% per annum by both forecasters). The fact that the employment rate follows the same trend in Scotland and UK despite slower growth in Scottish GDP per capita is explained by the SFC’s judgement that productivity (the amount of output per job) will grow more slowly in Scotland than the OBR forecasts for the UK.
- The SFC’s forecasts imply that average earnings will grow at the same rate in Scotland as the OBR forecasts for the UK. The fact that Scottish earnings are forecast to grow at the same rate as UK earnings, despite lower productivity growth in Scotland might appear a bit of a puzzle; at national level a common assumption is that earnings growth should broadly track productivity growth over the long run. But this relationship might be much weaker at sub-national levels or over shorter time periods (for example, earnings in Scotland might be more closely tied to UK productivity and UK wage settlements than they are to Scottish specific productivity).
- With the SFC forecasting that earnings and employment will trend in Scotland similarly to the UK, growth in Scottish income tax revenues would broadly match the UK in the absence of policy change. But combined with income tax changes in Scotland announced this year and last, Scottish income tax revenues are forecast to grow more quickly than they are in the UK – providing a boost to the Scottish budget.
What should we take from all this?
But whilst we often obsess about fairly marginal differences in economic data between Scotland and the rest of the UK, we should remember here that, given the necessarily wide confidence interval around any economic forecast, the differences between the SFC and OBR forecasts for growth in GDP and revenues are actually small. (The forecasts do not imply we will see anything like the divergence in fortunes that has been observed in the last 2.5 years).
True, there does remain an interesting empirical question about the extent to which Scottish earnings and employment growth will be linked to rates of per capita output growth in Scotland in future. But the big difference is between the forecasts for GDP and earnings growth over the next few years – at Scottish and UK levels – compared to what we became used to prior to 2008. It is this difference that has big implications for the public sector finances, at both Scottish and UK levels.
Post updated January 22 2018 via FAI
The most recent GDP figures show that the Scottish economy grew by just 0.2% Q3 2017, continuing the weak growth performance we have seen over the last 2½ years.
Here we pick out some of the key points from the data.
Growth continues but remains exceptionally fragile
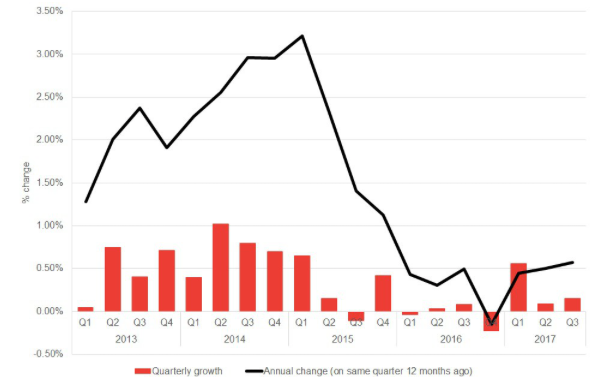
The aggregate GDP growth figure of +0.2% for the three months to September 2017 is well below Scotland’s long-term rate of growth. Indeed it was a whisker away from being even lower, with the unrounded figures showing an increase of +0.15%.
Over the year, growth was 0.6% compared to UK growth of 1.7%.
Chart 1 Annual and quarterly Scottish GDP growth since 2013
Production grew 1.2% over the quarter, driven by very strong growth in the electricity and gas supply sector but also sustained growth in manufacturing.
Output in the electricity sector was up by 8% over the quarter. On its own, this increase contributed +0.2% to Scotland’s overall GDP figure – i.e. equivalent to the entire net growth in the aggregate economy for the quarter!
Given its volatility, it is perhaps more interesting to look at this sector over time. One positive result is that the sector is now reporting levels of output higher than before Longannet was switched off in March 2016.
Services grew by a relatively modest +0.2%, with most sectors showing weak – but positive – growth (with the exception of financial and insurance activities).
Construction output fell once more, down nearly 3% over the quarter (and 7½% over the year). More of this below.
Data revisions to GDP per capita
Yesterday also saw the publication of revisions to some of the data. In particular, there were some downward revisions to the GDP per capita series for Scotland.
GDP per capita is interesting as it provides a useful measure of relative economic performance that adjusts for changes in population growth.
Where there are differences between two countries because of substantially different structural changes in population – e.g. as has been the case (and projected to continue to be the case) between Scotland and the UK – it can provide a helpful picture of the underlying strength of the local economy.
As we have discussed, GDP per capita is also vitally important for the operation of the new Fiscal Framework to the extent that tax receipts per capita are correlated with GDP per capita over the long-term.
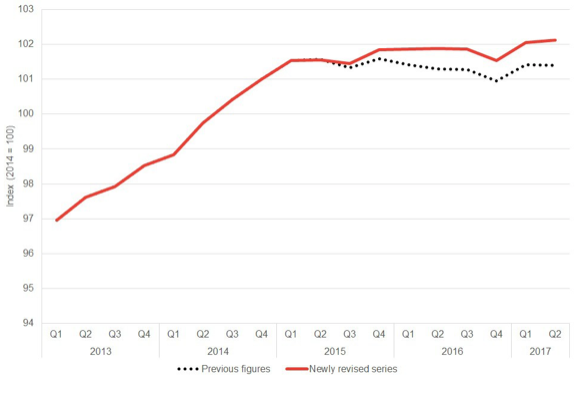
Chart 2 shows the time path of GDP per capita since 2013. We see that the statisticians have revised down growth in the Scottish series from early 2015 ever so slightly.
Whilst relatively small in the context of history, the revised figures now suggest that since 2015 – when the current slowdown in the Scottish economy started – whilst overall GDP has grown by a mere 1.1%, GDP per head has actually fallen by 0.1%. This flat lining in the economy over a sustained period is worrying.
Chart 2 GDP per capita – before and after today’s revisions
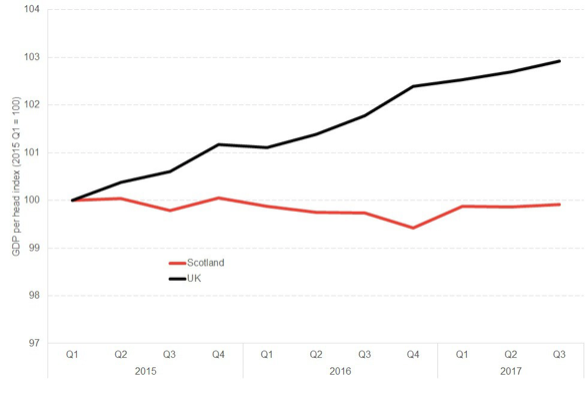
UK GDP per capita performance in recent years has also been weak. However, as Chart 3 highlights a gap has emerged between Scotland and the UK. It is now wider after these revisions.
Chart 3 GDP per capita Scotland and the UK since 2015
Of course, whether or not GDP and GDP per capita are perfect measures of economic performance is open to debate. They certainly do not provide a robust measure of wellbeing, prosperity or sustainability. But they do provide a useful proxy for overall activity in an economy. And given the importance of relative economic performance per head with the UK for the new Fiscal Framework, closing this gap in the years ahead will be important.
What explains these recent trends?
The downturn in the oil and gas sector has been frequently identified as the key reason for the slowdown in the Scottish economy in recent times, particularly relative to the UK.
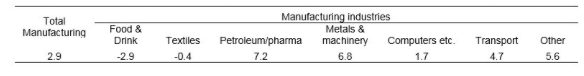
Since the fall in the oil price in late 2014/2015, sectors tied to the North Sea supply chain – most notably in manufacturing – have been badly affected. However, we have started to see a stabilisation in many of these sectors more recently. Manufacturing rose 0.4% this quarter and by 2.9% over the year.
Table 1 Growth in manufacturing over last 12 months
In more recent quarters, the biggest drag on the Scottish GDP numbers has not been sectors directly tied to the oil and gas supply chain but construction.
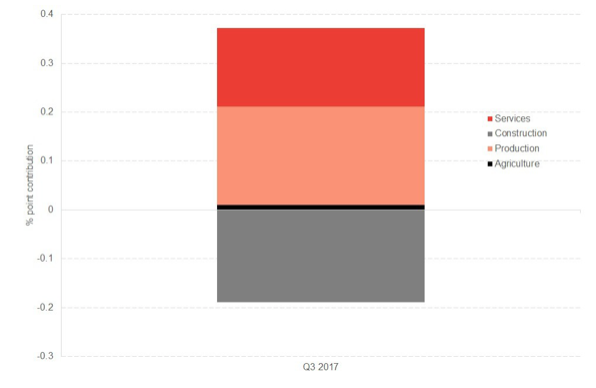
As Chart 4 highlights, construction knocked around 0.2% off the overall change in Scottish GDP in Q3 2017. Without that, the Scottish economy would have actually been close to trend.
Chart 4 Contribution to GDP growth by sector Q3 2017
This is not a one-off. Output in the construction sector has been falling now for 7 consecutive quarters.
The Scottish construction series has been displaying some rather odd characteristics in recent times.
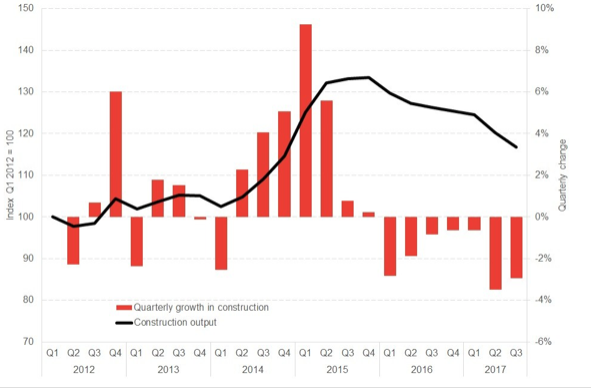
As Chart 5 highlights, there was very strong growth during the tail end of 2014 and early 2015. Over a two year period, construction output was estimated to have grown by 30%!!
Since then, we have seen falling output as the series adjusts to more normal levels.
Chart 5 Construction sector performance in Scotland since 2012
Scottish Government statisticians believe that the sharp increase in the series was driven by ”large transport and industrial infrastructure developments such as the Forth Replacement Crossing, Borders railway, M8 missing link and the Shetland Gas Plant.” The downturn has come as these projects have ended.
The underlying data from the ONS on output in the construction sector backs this up, with a spike in infrastructure spending in 2014 and 2015. There has also – in recent times – been a decline in private commercial construction.
But this still seems somewhat odd. Whilst it is the case that there have been number of major public infrastructure projects in Scotland in recent times, the overall capital budget of the Scottish Government has been rising so the public sector is still investing in infrastructure (perhaps not just very large and visible projects).
We suspect therefore that some of the changes we have seen in construction in recent times reflects the way in which activity is measured.
Once the series returns to trend, we should start to series more ‘normal’ patterns of growth.
In the meantime, the volatility in the construction series is having a significant impact on aggregate Scottish GDP.
To illustrate this, in Chart 6 we strip out from the aggregate Scottish GDP figure the impact of construction.
Chart 6 Scottish GDP since sharp rise in construction in 2014 – aggregate GDP with and without construction sector series
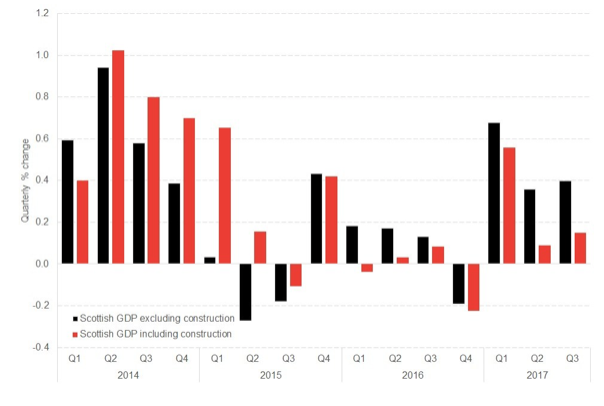
The chart shows that the time path of Scottish GDP looks quite different when the impact of construction is removed from the series. Firstly, growth in 2014 and 2015 would have been much lower than reported. For example, in Q1 2015 reported growth was 0.7% but virtually all of that came from construction.
Secondly, and perhaps of most interest, is that the recent performance of the Scottish economy has not been as bad as the aggregate figure suggests once the impact of construction has been removed. In particular, 2017 growth would have been closer to trend.
Clearly construction is an important sector in the economy and this is not to downplay its role or the challenges that it faces. However, given the somewhat surprising pattern of growth in the statistical series in recent years, it suggests once again that some caution is needed when interpreting key trends (and the sources of underlying growth/weakness in the Scottish economy).
So how do today’s numbers stack up against forecasts?
Firstly, our nowcasts projected slightly stronger growth between 0.3% to 0.4% for Q3 2017. But as pointed out above, removing construction from the series suggests that our nowcasts – which track overall growth in the economy rather than specific sectors – were pretty accurate.
Secondly, the Scottish Fiscal Commission published a quarterly estimate for Scottish GDP back in December. Back then, they forecast growth of +0.14% – remarkably close to today’s figure of +0.15%!! Not bad for their first forecast evaluation!!
Today’s figures are part of an increasingly consistent pattern – from unofficial sources like our nowcasts and business surveys and from official sources – that whilst the Scottish economy continues to grow, it does so at a fragile pace.
Next week we will get labour market data and we await to see if the relative weak growth will have any impact on the near record levels of employment that have been a feature of the Scottish economy in recent times.
Leave a Reply