
Scotland’s political and business class is overwhelmingly pro-EU and its electorate is on course to deliver a resounding majority vote in favour of Remain at the June 23 referendum on the UK’s membership.
Yet its economy does not reflect that same degree of positive integration: its goods and labour markets are not as closely linked with mainland Europe as the rest of the UK and its exports to the EU are stagnant, with its biggest overseas market the US.
Geographically, Scotland is, of course, on the periphery of Europe. But at least on one important economic measure, it is right in the centre. Scotland’s GDP per head is exactly equal to the EU average. That of the UK as a whole is a little higher, at 109 (EU=100). We can see this from Figure 1 showing an index of GDP per head adjusted for differences in purchasing power for a number of EU countries and regions. It includes not only Scotland as a whole, but also some of its regions (using the EU NUTS 2 classification.)
Figure 1: GDP per head in 2013 (adjusted for purchasing power) Index EU = 100
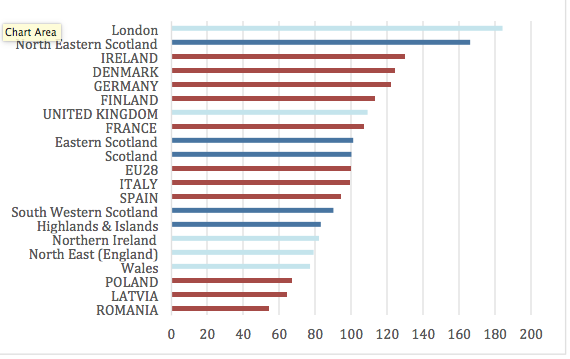
Source: Eurostat
Much of northern Europe has higher GDP per head than Scotland, while much of southern Europe and the countries that recently joined the EU from Eastern Europe have lower income per head. Within the UK, Scotland is also close to the middle of the GDP per head scale, higher than Wales, Northern Ireland and the North-East of England, but lower than the South of England, particularly London. Within Scotland there is also a wide distribution of income, ranging from the north-east which is almost on a par with London, to the Highlands and Islands whose income is barely above 80% of the EU average. Based on GDP per head, Scotland occupies a central position both within the UK and in the EU as a whole. In EU terms, the Scottish economy is neither an unqualified success nor an unqualified failure.
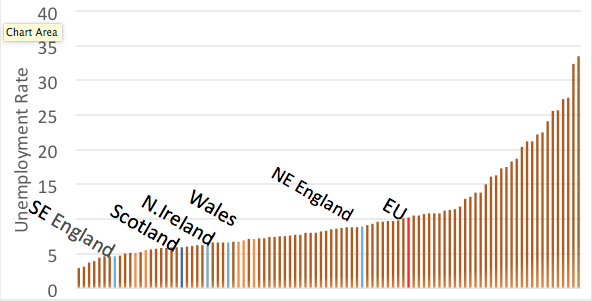
Its labour market outcomes are, however, significantly better than those in most other comparable areas of the EU. Figure 2 shows unemployment rates for all of the subnational areas (known as NUTS 1 regions) that comprise the 28 member states during 2014, with the levels for Scotland and for the EU as a whole highlighted. With an unemployment rate of 5.2%, Scotland clearly has one of the lower unemployment rates among these regions. This relative strength is mirrored in other labour market indicators.
Figure 2: Unemployment Rates by NUTS 1 Regions 2014
Stagnant exports
However, showing how well or how badly the Scottish or the UK economy performs relative to other parts of the EU does not shed any light on their integration into the EU ‘single market’. Market integration would be reflected in high levels of trade and by movements of capital and of labour between Scotland or the UK and the EU. Data on Scottish exports have to be treated with some care, but the Scottish Government statisticians make an effort to make these as accurate as possible.
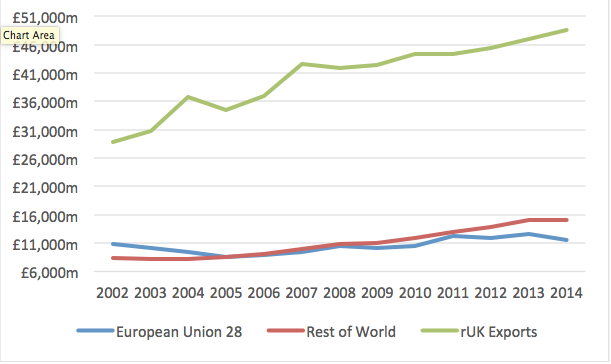
Figure 3 shows the value and destination of Scottish exports between 2002 and 2014.
The possible destinations are the rest of the UK (rUK), the rest of the EU and the rest of the world. It is immediately clear that rUK is the major market for Scottish exports and that it has grown significantly over the period. Exports to the rest of the world started from a much lower base, but have almost doubled between 2002 and 2014. In contrast to the growing value of exports both to rUK and to the rest of the world, exports from Scotland to the EU have stagnated. This pattern of weakening exports to Europe and rapidly growing exports to the rest of the world has also occurred for the UK as a whole.
It is striking that even though Scotland is part of the EU single market, the US is Scotland’s top international export destination. The weakness of exports to the EU may reflect the overall weakness of the European economy, the strength of the pound and competition from other markets. Even thoughforeign direct investment in Scotland is reasonably buoyant, it does not seem that such investment is being used to make Scotland a platform for accessing EU markets in the same way that, for example, occurs in Ireland.
The export data do not capture the tourism market which was worth around £9.7bn to Scotland in 2014: 1.1m international visitors came here in the first half of 2015. Even though exports to the EU have been flat, increased visitor numbers from Europe have been driving increased tourist spending in Scotland which, like manufactured exports, add to foreign currency earnings.
Figure 3: Scottish Exports by Destination 2002 – 2014
EU migrants in Scotland
Is Scotland integrated into the EU labour market? Like the rest of the UK and Ireland, Scotland received an influx of EU migrants starting in 2004 following the accession of eight former Soviet bloc countries. These migrants boosted Scotland’s population, which has now reached 5.3m, its highest level since records began. They also had a significant impact on the economy: most of the substantial economic research on their impact on the UK as a whole suggest that they:
• boost economic growth;
• make a substantial contribution to public services through the taxes they pay;
• are less likely than natives to be supported by the welfare system and
• have had only modest effects on the employment and conditions of native-born workers.
Has Scotland experienced the same increase in EU workers as other parts of the British Isles? Table 1 below shows the population of the UK’s major cities and the breakdown between nationals, foreigners from the rest of the EU and foreigners from the rest of the world. For comparative purposes, it also includes the same data for London and Dublin. While it is clear that EU foreigners make up a significant proportion of the population in Scotland’s more prosperous cities, Aberdeen and Edinburgh, their share is still significantly lower than that in London and in Dublin. This may reflect Scotland’s accessibility and perhaps also the dominance of London within the UK economy. The London effect is less relevant to Dublin, which can to some extent differentiate its economic environment from that of the UK.
Weaker labour markets attract fewer migrants: the share of EU foreigners in the populations of Glasgow and Dundee is around half that in Aberdeen and Edinburgh. Interestingly, with the exception of Glasgow, all of the cities have approximately the same proportion of non-EU foreigners as EU foreigners in the population. Glasgow is the exception in having a significantly greater proportion of non-EU foreigners, perhaps a result of it having a larger share of migrants from the Commonwealth. Edinburgh and Aberdeen have a higher share of EU migrants than many large English cities outside London, suggesting perhaps that they have a more cosmopolitan flavour? Nevertheless, their shares are less than cities where higher education plays an important part in the economy (Oxford, Cambridge). Higher education can make a significant contribution to the exchange of both people, ideas and technology. Another exception is Belfast,where linkages with the Irish Republic and absence of controls on movement are likely to influence the very high proportion of EU foreigners present. If Scotland was independent, the rest of the UK remained in the EU and the labour market continued as before, the proportion of EU foreigners in Scotland would increase by 14% in Edinburgh and 9% in Aberdeen – the shares of their respective populations born in the rest of the UK.
Table 1: Nationals, Foreigners and Proportion of Foreigners (EU and Non-EU) Major Cities
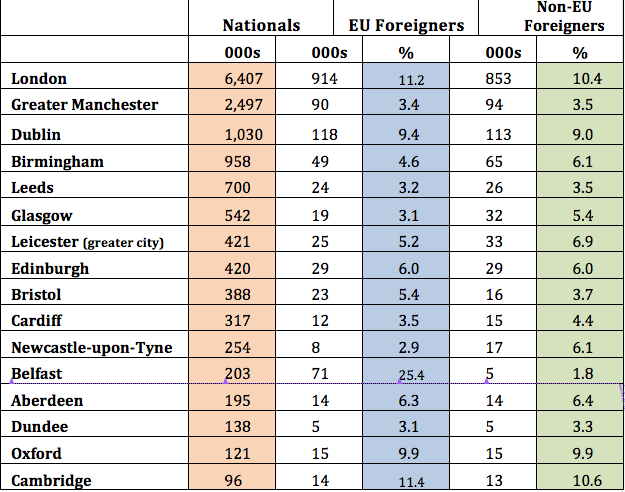
Source: Eurostat
To complete the picture, it would be good to comment on the extent of Scotland’s imports from the EU and on the outflows of Scots working and living in the rest of the EU. Unfortunately, the data are wanting. While it is possible to analyse the UK’s trade balance with the EU (the UK had a £97bn trade deficit with the EU in 2015) and the number of UK nationals living in the EU (around 1.8m), no comparable figures are available for Scotland.
What juste retour?
However, it is possible to estimate Scotland’s balance sheet with the EU – what Scots contribute to the EU budget and how much they get back. In the past, Scotland was a net beneficiary of EU largesse. This is no longer the case for a number of reasons:
• growth in the EU budget has been brought to a halt, partly through British pressure. In 2015, the EU budget was set at €141.2bn (£110bn). This covers expenditure in all 28 member states. For comparison, the 2015-16 UK budget is £776bn. The UK budget covers healthcare, education, welfare, pensions et cetera. In comparison the EU budget has a much narrower remit. It focuses on supporting: (1) activities promoting growth including research and development, (2) supporting fisheries, farming and the environment, (3) security and citizenship, (4) international aid and foreign policy
• EU regional aid has switched to the former Soviet bloc states following their accession. This is because current rules only allow for such aid to be given to new regions where GDP per head is below 75% of the EU average. In the UK only parts of West Wales, the Valleys and Cornwall qualify as ‘less developed regions.’ None of the constituent parts of Scotland currently qualify under that rule, while Figure 4 shows how far the relatively modest budget on regional aid (€51.1bn) has to be spread across large swathes of southern and eastern Europe. Only the Highlands and Islands, Northern Ireland and a few regions of England qualify as a ‘transition region’ for very limited regional support. Much more significant to Scotland are the payments of around £600m from the Common Agricultural Policy (CAP). In addition, Scottish universities and companies benefit from a small flow of research and development funding channelled through the Horizon 2020 funding stream.
Estimates of EU spending in the UK nations were made recently by the Centre for European Reform. Although CAP is worth more than £2.2bn in England, spending per head, at £32, is less than a third of that in Scotland. This reflects the greater importance of agriculture in the Scottish economy. Wales is in a similar position to Scotland, but CAP support is even higher in Northern Ireland, at £145 per head. Structural fund spending per head in Scotland only narrowly exceeds that in England. It is much higher in Wales where West Wales and the Valleys fall below the 75% criterion for full structural fund eligibility (see Figure 4).
Table 2: Spending on CAP and on Structural Funds (per Year 2014-20)
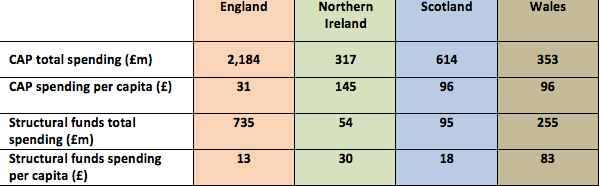
Source: Centre for European Reform
Figure 4: Eligibility for Structural Funds Support 2014-20
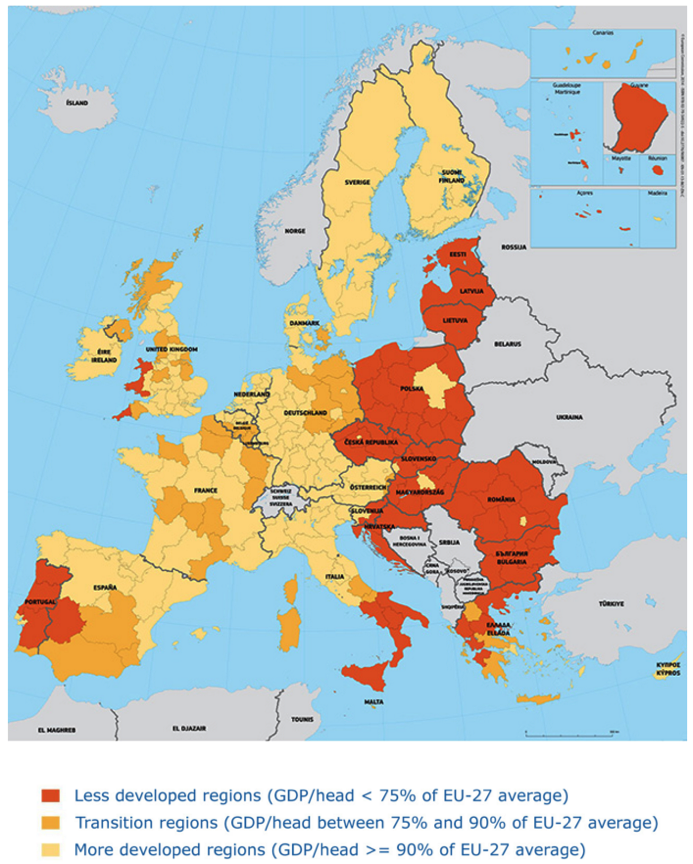
Source: European Commission
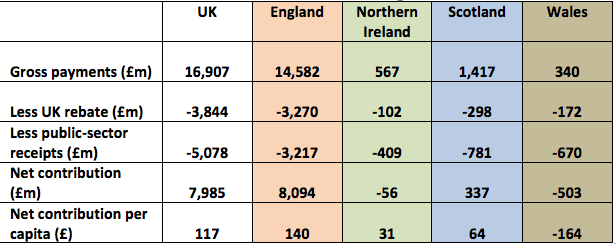
The Centre for European Reform also provides estimates of the fiscal deficit or surplus associated with EU transactions. These are shown in Table 3, again for each of the UK’s nations. For the period 2014-20, the UK will pay around £16.9bn into the EU budget each year. Almost a quarter of this will come back through the rebate system originally negotiated by Mrs Thatcher’s government. A further £5bn comes back through the CAP, structural fund payments and various smaller funds including those supporting scientific and technological research. This leaves the UK with a net contribution of around £8bn per year which equates to £15m per week or £2.25 per person per week. Such figures are often used to create alarm, but are relatively minor in relation to the trade flows between Britain and Europe.
Using data on tax receipts from the constituent nations, it is clear that the largest contribution both in overall size and per capita is coming from England. In contrast, Wales is receiving more from the EU than it is contributing in tax receipts – around £503m per year. And Scotland makes a small net contribution of £337m per annum, which equates to £64 per person per year net contribution. This is tiny in comparison to Scotland’s fiscal deficit with the rest of the UK, which was most recently estimated at £14.9bn.
Table 3: Net Annual Contribution to the EU Budget UK Nations 2014 – 20
It is also worth noting that Norway and Switzerland, which are both nominally outside the EU, make a net contribution to the EU budget as part of their deals to be part of a free trade area with the EU. According to the House of Commons Library , Norway contributed around £106 per capita in 2011, while Switzerland contributes around £53 per capita. The net contribution of each UK citizen to the EU budget was therefore not much higher than that of peoplein Norway, despite the fact that they are not members of the EU.
Conclusion
So what does this all mean? The economy of the UK and Scotland is relatively close to the EU average in terms of income per head: Scotland, and most other regions of the UK, other than London and the South-east, are well short of any yardstick that would classify them as among the more affluent EU regions. Nevertheless, their labour markets are performing relatively well. Scotland’s goods and labour market are not as heavily integrated with the EU as the rest of the UK and its exports to the EU have flatlined. It no longer qualifies for the regional assistance that was available in the past, though Scottish agriculture still receives a significant level of support from Europe. Finally, Scotland’s ‘account’ with the EU is broadly in balance and is relatively small in relation to both its deficit with therest of the UK and the size of the trade flows between Scotland and Europe.
This is an edited version of an article in Britain’s Decision published by the Hunter Foundation
Photo: Scottish Government
Readers may also consult David Torrance’s Electoral Reform Scotland book or guide for voters
Leave a Reply